REGIONALITY SPREAD
AND SEASONALITY
REGIONAL SPREAD
Distribution of Malaria
Given our findings of sharp spatial variability in the distribution of malaria, and observations along these lines from Regional Malaria Officers, it was important to undertake analysis at scales finer than the district scale. The availability of digitized village-level data is limited to about 10 years for only a few districts. The spatial variability at the village scale appears to be governed by vulnerability factors rather than climate. Thus, we undertook the analysis at sub-district scales that are used by the Ministry of Health agencies. Malaria cases has been mostly seen in the northern and southern region of the country as per the analyzed data bases.
Malaria at MOH Sub-District scales


The malaria numbers are based on laboratory-confirmed incidence data obtained from the Sri Lanka Anti-Malaria Campaign (AMC) for the period from 1963-2003.
SEASONALITY AND CLIMATE
The regional character of the malaria distribution is brought out in relation to topography by considering the four climatically homogenous regions – Eastern, Western, Northern and Southern Plains. The Eastern and Western regions are further subdivided into the Eastern and Western coasts and hills. This classification makes sense from the point of view of the monsoonal wind directions (North-Easterly and Westerly) which lead to enhancement of rainfall on the Eastern and Western hill slopes during the respective monsoon seasons.

Rainfall climate, as well as malaria incidence in Sri Lanka, is largely bimodal. The agricultural seasons Yala (April to September) and Maha (October to December) capture the bimodality of rainfall with rainfall during the early part of the season followed by dry period towards the end. Malaria incidence follows two months after the rainy season and it is possible to use the agricultural seasons to capture the two main modes of malaria incidence.
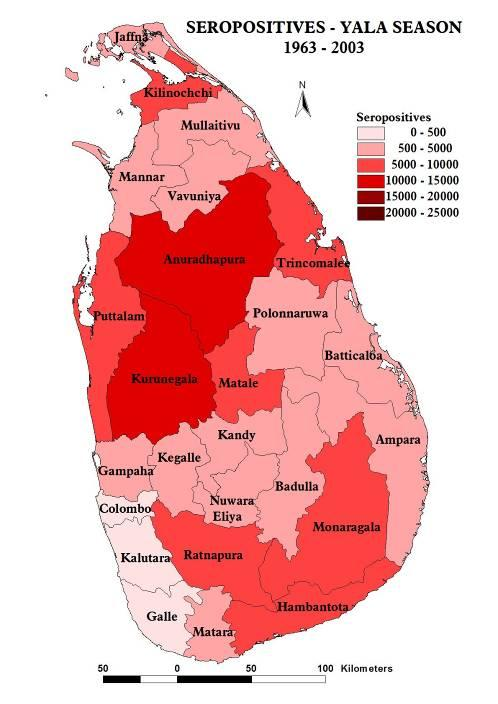
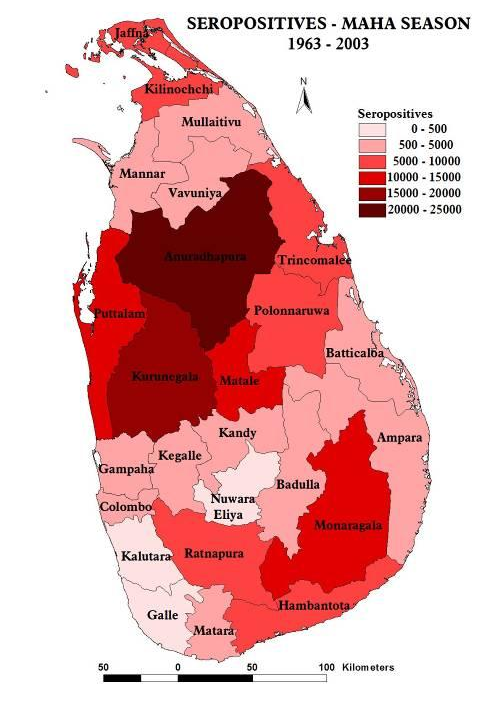
Seasonal maps for both seasons show similarities and some important differences. Overall the Maha incidence is largely greater than the Yala incidence. The malaria incidence is particularly enhanced in Maha in the regions to the North, whereas regions to the South have comparable malaria incidence in both seasons.


Figure 7 – The regional distribution of malaria incidence show during Yala (April to September) and Maha (October to December).
